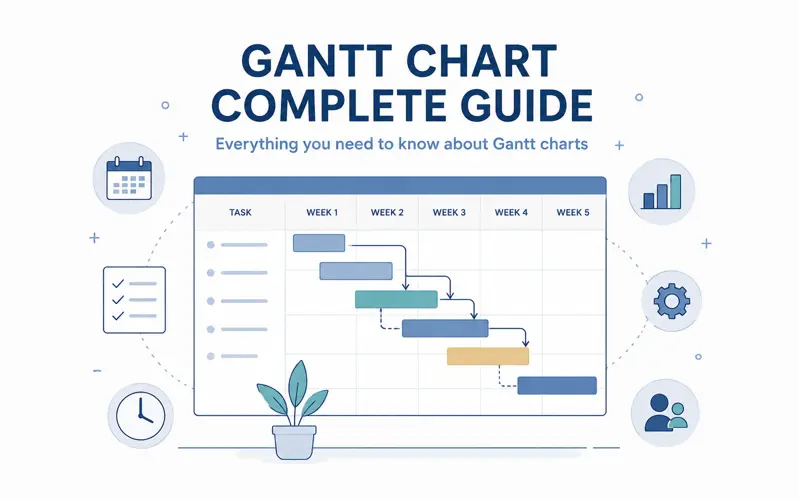
Gantt Chart: The Complete Guide to Project Timeline Planning
A Gantt chart is one of the most widely used project management tools for planning, scheduling, and tracking work over time. Whether you're managing a small internal project or coordinating hundreds of tasks across multiple teams, a Gantt chart provides a clear visual timeline that helps everyone understand what needs to happen, when it should happen, and who is responsible for each activity.
Originally developed more than a century ago, the Gantt chart remains one of the most valuable planning tools because it transforms complex project schedules into an easy-to-understand visual timeline. Managers can instantly identify task dependencies, monitor progress, detect scheduling conflicts, and adjust plans before delays occur.
Today, modern project management software has expanded the traditional Gantt chart with real-time collaboration, automatic scheduling, workload balancing, resource planning, and progress tracking. Instead of manually updating spreadsheets, project managers can instantly visualize project health and make better decisions using live data.
This comprehensive guide explains everything you need to know about Gantt charts, including how they work, their advantages and limitations, best practices, common mistakes, and how they integrate with modern project management systems.
What Is a Gantt Chart?
A Gantt chart is a visual project timeline that displays tasks as horizontal bars along a calendar. Each bar represents a task, showing its planned start date, finish date, duration, and current progress.
Unlike a simple task list, a Gantt chart illustrates how project activities are connected. Managers can immediately understand task order, overlapping work, milestones, and project deadlines.
Every project task occupies a position on the timeline, making it easier to coordinate people, equipment, and project resources.
Main Components of a Gantt Chart
Although Gantt charts may vary between software applications, most include the same core elements.
| Component | Description |
|---|---|
| Task Name | Individual project activity. |
| Timeline | Days, weeks, or months. |
| Task Bars | Visual representation of task duration. |
| Milestones | Important project events. |
| Dependencies | Relationships between tasks. |
| Progress | Percentage of completed work. |
Together, these elements provide a complete overview of project progress and planned activities.
Why Gantt Charts Are Important
Managing projects without a timeline often leads to confusion about priorities, deadlines, and responsibilities.
A Gantt chart solves this problem by showing the entire project schedule in one place. Everyone involved can immediately understand what has already been completed, what is currently in progress, and which activities are planned for the future.
Organizations using Gantt charts commonly experience:
- Better project visibility.
- Improved scheduling.
- Fewer missed deadlines.
- Better communication.
- Improved resource planning.
- More accurate forecasting.
- Higher project success rates.
How a Gantt Chart Works
Each project begins with a list of tasks. After defining activities, project managers estimate how long each task will take and determine the sequence in which work should be completed.
Every task is then displayed as a horizontal bar on the timeline. Longer bars represent tasks requiring more time, while shorter bars indicate activities with shorter durations.
As work progresses, the completed portion of each bar is updated, allowing the entire team to monitor project status in real time.
Understanding Task Dependencies
Many project activities cannot begin until other tasks have been completed. These relationships are known as task dependencies.
For example, construction workers cannot install roofing before the building's structural framework has been completed. Likewise, software testers cannot begin testing features that developers have not yet finished.
Displaying dependencies on a Gantt chart helps managers understand how delays in one activity may affect the overall project schedule.
Milestones
Milestones represent important events within a project rather than ongoing activities.
Examples include:
- Project approval.
- Design completion.
- Prototype delivery.
- User acceptance testing.
- Customer sign-off.
- Project launch.
Milestones help teams measure progress toward significant project objectives.
Critical Path
The critical path is the sequence of tasks that directly determines the minimum time required to complete a project.
Any delay affecting tasks on the critical path will delay the entire project unless corrective action is taken.
Understanding the critical path allows managers to focus attention on the activities that have the greatest impact on project delivery.
Example Gantt Timeline
| Task | Week 1 | Week 2 | Week 3 | Week 4 |
|---|---|---|---|---|
| Requirements | ■■■■ | |||
| Design | ■■■■ | |||
| Development | ■■■■ | ■■■■ | ||
| Testing | ■■■■ | ■■■■ | ||
| Deployment | ■■■■ |
This simple timeline illustrates how project phases overlap while maintaining a clear sequence of work.
Who Uses Gantt Charts?
Although Gantt charts are closely associated with project management, they are used across many industries, including:
- Software development.
- Construction.
- Manufacturing.
- Marketing.
- Engineering.
- Healthcare.
- Education.
- Event planning.
- Consulting.
- Government projects.
Any organization coordinating multiple tasks over time can benefit from a well-designed Gantt chart.
If you are new to project planning, continue with our guide Project Planning Step by Step .
You may also want to read Project Management: The Complete Guide , which explains how Gantt charts fit into the overall project management process.
Planning Projects with a Gantt Chart
One of the greatest advantages of a Gantt chart is its ability to transform a simple task list into a complete project schedule. Instead of seeing isolated activities, managers gain a visual overview of the entire project lifecycle.
Planning typically begins by identifying project deliverables and breaking them down into smaller tasks. Each task receives an estimated duration, a planned start date, an expected finish date, and a responsible team member.
Once tasks are placed on the timeline, managers can immediately identify overlapping activities, dependencies, and potential scheduling conflicts.
Estimate Task Duration
Accurate task duration estimates are essential for creating reliable project timelines.
Many delays occur because project managers underestimate how long activities will actually take.
When estimating duration, consider:
- Previous similar projects.
- Employee experience.
- Task complexity.
- Available resources.
- Potential risks.
- Approval processes.
Realistic estimates create schedules that teams can actually achieve.
Assign Resources to Tasks
Every task should have clearly assigned resources. This may include employees, contractors, equipment, meeting rooms, vehicles, software licenses, or specialized machinery.
Assigning resources directly on the Gantt chart allows managers to identify resource conflicts before work begins.
For example, if the same engineer is scheduled for two projects during the same week, the conflict becomes immediately visible.
Track Project Progress
A Gantt chart becomes increasingly valuable as work progresses. Managers can compare planned schedules with actual progress and quickly identify activities falling behind schedule.
Typical progress indicators include:
- Not Started.
- In Progress.
- Completed.
- Delayed.
- Blocked.
Keeping task progress updated allows the entire team to understand current project status without lengthy meetings.
What Is a Project Baseline?
A project baseline is the original approved version of the project schedule. It serves as a reference point for measuring future performance.
Once work begins, managers compare actual dates against the baseline to identify schedule changes, delays, and completed milestones.
Without a baseline, it becomes difficult to determine whether the project is ahead of schedule, on time, or delayed.
Managing Schedule Changes
Few projects finish exactly as originally planned. Customer requirements change, unexpected issues arise, and priorities shift.
Modern Gantt software allows managers to update schedules while automatically adjusting dependent tasks.
Instead of rebuilding the project plan manually, changes are reflected across the entire timeline in seconds.
Critical Path Analysis
Critical Path Analysis identifies the sequence of activities that determines the project's completion date.
Managers should closely monitor tasks on the critical path because even a small delay can postpone the final delivery date.
Benefits of monitoring the critical path include:
- Better schedule control.
- Improved risk management.
- Earlier identification of delays.
- More accurate forecasting.
- Better resource prioritization.
Gantt Chart vs Kanban Board
Although both tools support project management, they solve different problems.
| Feature | Gantt Chart | Kanban Board |
|---|---|---|
| Main Purpose | Timeline planning | Workflow management |
| Focus | Dates and schedules | Task status |
| Dependencies | Excellent support | Limited |
| Deadlines | Highly visible | Basic |
| Daily Task Tracking | Moderate | Excellent |
Many organizations use both tools together. A Gantt chart manages long-term planning, while Kanban boards support daily execution.
Gantt Chart vs Calendar
Project calendars and Gantt charts complement each other but serve different purposes.
Calendars display meetings, deadlines, appointments, and individual events, while Gantt charts visualize the entire project schedule with task durations, dependencies, and milestones.
Using both provides a complete view of project activities.
Example: Software Development Project
A software development team is building a customer portal.
The Gantt chart begins with requirements gathering, followed by UI design, backend development, frontend implementation, testing, user acceptance testing, and deployment.
Because each phase depends on the previous one, project managers can easily identify which delays will affect the launch date.
Example: Construction Project
A construction company plans a new office building.
The timeline includes permits, excavation, foundations, structural work, roofing, electrical installation, plumbing, interior finishing, inspections, and handover.
Dependencies ensure that activities occur in the correct sequence while resource planning prevents multiple projects from competing for the same equipment.
Example: Marketing Campaign
A marketing department schedules a product launch campaign using a Gantt chart. Tasks include market research, content writing, graphic design, advertising, email campaigns, social media promotion, and campaign analysis.
The visual timeline allows managers to coordinate multiple specialists while ensuring that every activity is completed before launch day.
Integrating Gantt Charts with Other Project Management Tools
Modern organizations rarely rely on a Gantt chart alone. The best project management platforms combine timeline planning with workload management, resource planning, task management, employee scheduling, shared calendars, and reporting.
Integrating these tools provides complete visibility into project health while reducing manual administrative work.
If you also manage daily workflows, continue with Kanban Board: The Complete Guide .
For managing employee capacity, read Workload Management: The Complete Guide .
If your projects involve multiple departments and shared resources, you may also benefit from Resource Management: The Complete Guide .
Gantt Chart Best Practices
Creating a Gantt chart is only the first step. Successful project managers continuously review, update, and improve their schedules throughout the project lifecycle. A well-maintained Gantt chart becomes a reliable source of truth for the entire team and helps prevent misunderstandings about priorities, deadlines, and responsibilities.
The following best practices help organizations get the maximum value from their project timelines.
- Create the project schedule before work begins.
- Break large projects into manageable tasks.
- Define clear milestones.
- Assign every task to a responsible person.
- Use realistic task duration estimates.
- Review dependencies carefully.
- Track progress every day.
- Update schedules immediately after changes.
- Monitor the critical path.
- Review resource availability weekly.
- Keep project stakeholders informed.
- Archive completed projects for future planning.
Common Gantt Chart Mistakes
Many scheduling problems are caused not by the software itself but by poor planning practices. Recognizing these mistakes early helps project managers avoid delays and improve project execution.
- Creating tasks that are too large.
- Ignoring task dependencies.
- Using unrealistic deadlines.
- Not updating progress regularly.
- Assigning one employee to multiple critical tasks.
- Ignoring vacations and public holidays.
- Failing to review resource availability.
- Changing schedules without communicating updates.
- Monitoring only deadlines instead of progress.
- Creating overly complicated project plans.
Benefits of Modern Gantt Software
Modern project management software has transformed traditional Gantt charts into collaborative planning systems. Instead of static diagrams, project timelines are now connected to tasks, resources, calendars, dashboards, and reporting tools.
Typical capabilities include:
- Automatic scheduling.
- Drag-and-drop timeline editing.
- Task dependencies.
- Resource allocation.
- Workload management.
- Progress tracking.
- Project baselines.
- Shared team calendars.
- Real-time collaboration.
- Interactive reporting dashboards.
Real-World Example: Software Company
A software company develops a new customer portal over six months. The project includes business analysis, UX design, backend development, frontend implementation, testing, documentation, user training, and deployment.
Using a Gantt chart, project managers immediately identify that delaying the UX design phase will also postpone development and testing. By reallocating an additional designer during the first month, the team protects the overall delivery schedule.
Real-World Example: Construction Project
A construction company coordinates dozens of subcontractors across several building phases. Excavation, foundations, structural work, electrical installation, plumbing, roofing, and finishing all depend on one another.
The Gantt chart clearly shows which activities may run in parallel and which must be completed before the next phase can begin. This visibility reduces downtime while improving coordination between contractors.
Real-World Example: Marketing Campaign
A marketing team prepares the launch of a new product. Writers, designers, advertising specialists, SEO experts, and social media managers all contribute to the campaign.
By planning every activity on a shared Gantt timeline, the marketing manager ensures that content creation, design approval, advertising setup, and email campaigns are completed before launch day.
Gantt Chart Checklist
- Define project objectives.
- Create a complete task list.
- Estimate task duration.
- Assign task owners.
- Identify dependencies.
- Create milestones.
- Allocate project resources.
- Review employee availability.
- Track project progress.
- Monitor the critical path.
- Review project risks.
- Update the schedule weekly.
- Compare actual progress with the baseline.
- Communicate schedule changes.
- Review resource utilization.
- Archive completed projects.
- Use reports to improve future planning.
Frequently Asked Questions
What is a Gantt chart?
A Gantt chart is a visual project timeline that displays tasks, durations, dependencies, milestones, and project progress.
Why is a Gantt chart useful?
It improves project planning, scheduling, communication, and progress tracking while helping managers identify delays before they become critical.
What industries use Gantt charts?
Gantt charts are widely used in software development, construction, manufacturing, engineering, healthcare, education, consulting, marketing, and many other industries.
Can a Gantt chart manage multiple projects?
Yes. Modern project management software allows managers to plan and monitor multiple projects simultaneously while sharing resources between them.
What is the critical path?
The critical path is the sequence of project tasks that determines the shortest possible completion time. Delays on the critical path usually delay the entire project.
Can Gantt charts be combined with Kanban boards?
Absolutely. Many organizations use Gantt charts for long-term planning and Kanban boards for daily task execution.
How often should a Gantt chart be updated?
Project schedules should be reviewed regularly. Most teams update progress daily or weekly depending on project complexity.
Related Articles
- Project Management: The Complete Guide
- Project Planning Step by Step
- Task Management: The Complete Guide
- Kanban Board: The Complete Guide
- Workload Management: The Complete Guide
- Resource Management: The Complete Guide
- How to Track Project Progress Effectively
- How to Reduce Project Delays
- Time Management: The Complete Guide
- Employee Scheduling: The Complete Guide
Final Thoughts
A Gantt chart remains one of the most powerful tools for project planning and timeline management. It gives project managers a clear overview of tasks, deadlines, dependencies, milestones, and resource allocation, making complex projects significantly easier to manage.
When combined with workload management, resource planning, employee scheduling, and real-time reporting, a Gantt chart becomes much more than a timeline—it becomes the central planning tool for successful project delivery.
MyPlannerDesk includes an interactive Gantt Chart that enables teams to plan projects visually, create task dependencies, define milestones, assign resources, monitor progress, and quickly adjust schedules using drag-and-drop editing. Integrated with Kanban Boards, Workload Management, Resource Management, Employee Scheduling, Shared Calendars, and Reporting, it provides a complete project management solution from planning to completion.
Whether you're managing software projects, construction work, marketing campaigns, consulting engagements, or internal business initiatives, using a modern Gantt chart helps your team stay organized, meet deadlines, improve collaboration, and deliver projects successfully.